NETWORK PERFORMANCE

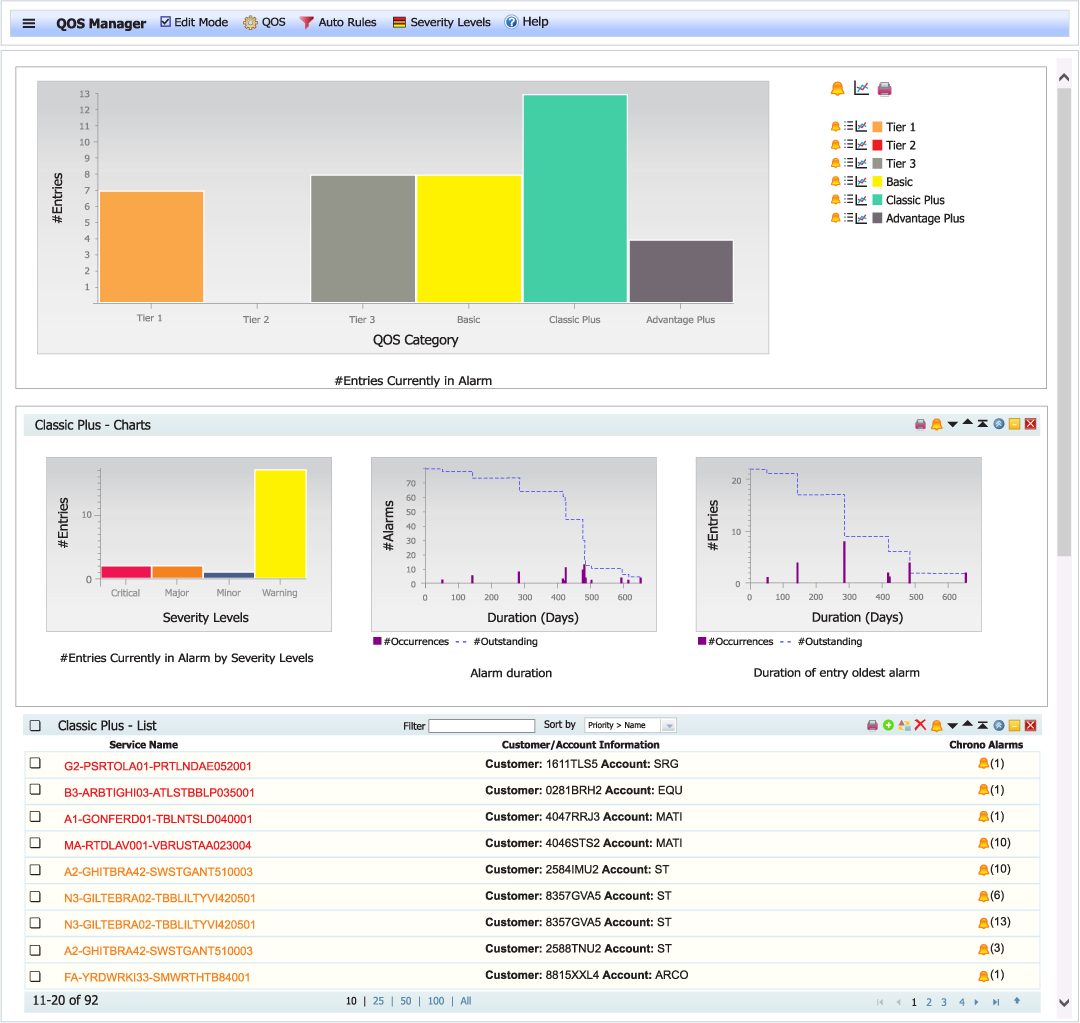
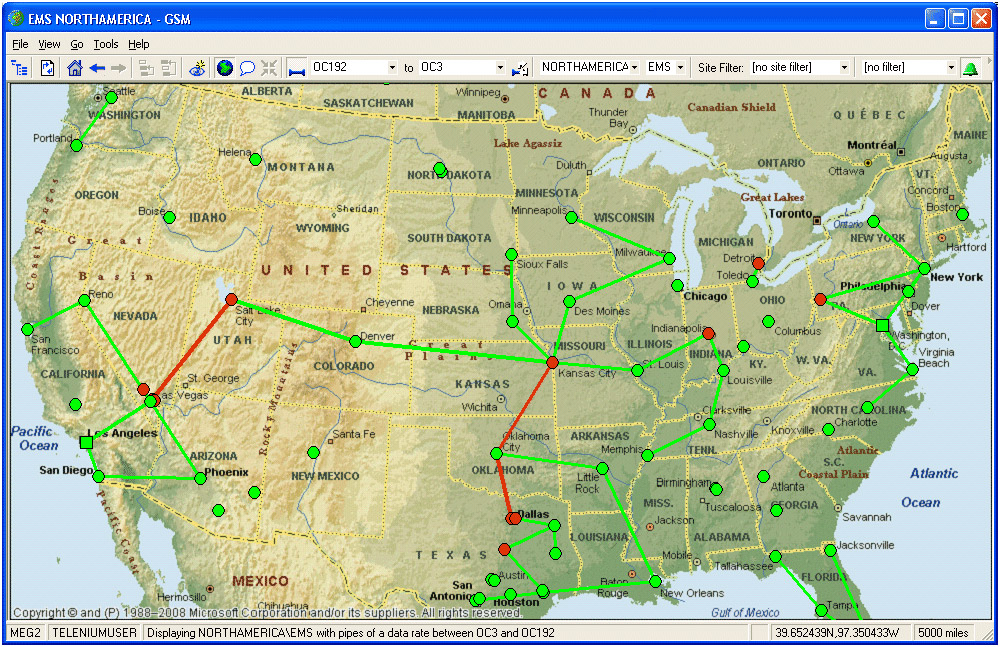
Our network performance monitoring applications allow you to make sure you’re getting the most out of your network. Telenium® network management software supports analog performance monitoring data with up to five user-defined threshold levels. Network performance application rate-of-change thresholds can be configurable as absolute or directional, based on your data analysis needs.

Because of the unique hierarchical design of the database, the impact of an alarm within the network context is quickly and easily seen. This allows operators to identify equipment, facilities, and customers affected by these failures.

REAL TIME GRAPHICAL TRENDS

Telenium provides real-time graphical displays of network performance statistics. The most recent 120 values of network performance monitoring data are maintained in your database for immediate trend analysis. Network performance monitoring data can also be historically archived to allow trending for long-term analysis.

Users can design performance trends with the Graphics Editor (GED) for monitoring bit error rates and other user-definable network performance thresholds.

NETWORK ELEMENT PERFORMANCE CHARTING

Network Element Performance Charting provides a graphical display of performance information that has been published to the Telenium database. Two kinds of performance data can be collected: Analog Input (AI) and PC Health.

QUALITY OF SERVICE MONITORING

Quality Of Service (QOS) Manager enables monitoring QOS information generated by any type of network element. This application enables you to monitor your service level agreements to ensure that your customers are receiving the level of service they are paying for.

SERVICE TRAVERSAL

The service traversal application shows you the entire chain of a service. You can see if a pipe or cross connect is missing, and if there are broken endpoints the ports display as yellow circles. You can also select a point in the chain and launch another application.

GRAPHIC SCREEN MANAGER (GSM)

Graphic Screen Manager is a mouse-driven, graphical user interface to display dynamic database information geographically. A geographical GSM presents alarms and their network locations, while the graphical manager depicts real-life representations of physical equipment.

GRAPHICAL EDITOR (GED)

GED is a Telenium module that provides a paint environment for creating maps and equipment displays, allowing our users to create custom graphics based on their needs.

SERVICE LAYOUT

Capable of displaying the entire layout of a service connection, Service Layout presents only the high level view as a starting point. You can view details of the service, such as service attributes, performance monitoring information, and alarm information, by expanding the components or member connections.