FAULT MANAGEMENT

Telenium® provides operators with fault management capabilities, allowing them to detect network failures and navigate though affected equipment to isolate and correct any problems efficiently and effectively. This functionality is achieved through a fast, high-resolution graphic interface connecting you to a high performance database.

Because of the unique hierarchical design of the database, the impact of an alarm within the network context is quickly and easily seen. This allows operators to identify equipment, facilities, and customers affected by these failures.

ALARM CHRONO

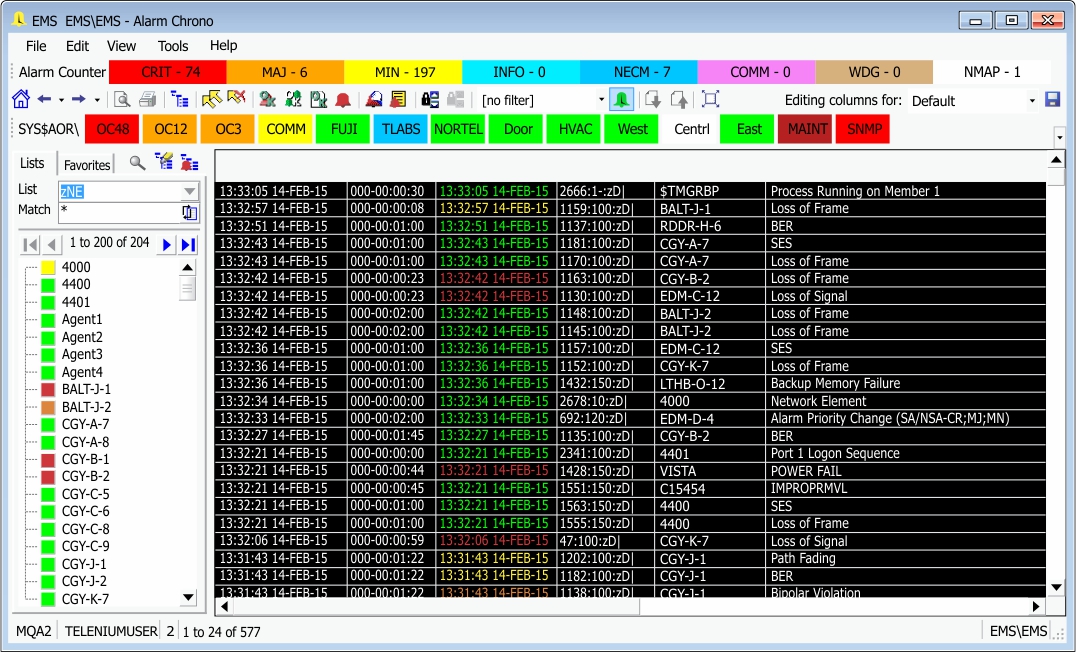
Alarm surveillance is crucial for detecting network problems. Telenium’s network fault management applications continuously process thousands of alarms per second and automatically sorts alarms into user configurable groups. System Administrators can color code alarms so their priority reflects the severity of the originating alarm.

Alarm Chrono displays current alarm lists and alarm information for all equipment in the network, and can be used to acknowledge, enable, disable, and sort alarms for enhanced system monitoring. Alarm comments can also be added to alarms to help field technicians communicate with operators.

ALARM HISTORY

Alarm History

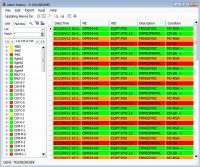
The Alarm History application allows you to view the local Alarm History stored in your database. The number of history entries stored in the logs at the Network Element and Global level is determined from the tunable parameter found in the $NODE record. Site and Group levels show history for all Network Elements within them (to the entry limit for each NE). Global (Node) history is limited by the maximum limit as determined in the tunable parameters.

ALARM COUNTER

Alarm Counter

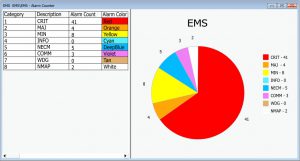
Uses presentation views, charts and 3d rotations to provide a categorized count and graphical screen of active alarms.

ALARM PROCESSING

alarm processing

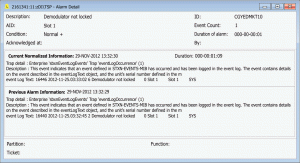
Alarms are displayed graphically within seconds of being received from the network element. Network fault management alarm data consists of conditions reported by the field equipment. All alarm event details, including the original message received from the element, can be archived for post analysis.

SELF MONITORING SYSTEM

image description

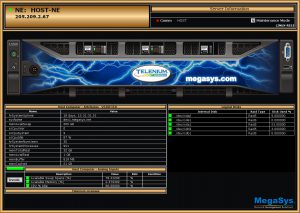
The Telenium system monitors itself and raises alarms when disk or other system faults occur (such as disk or memory capacities reaching dangerously low conditions, applications consuming excess CPU time, or applications failing unexpectedly). All Telenium system applications are monitored and automatically restarted if a failure occurs.

ADVANCED LOGIC PROCESSOR

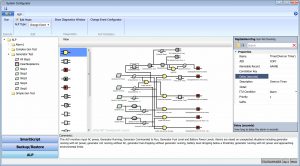
Advanced Logic Processor

Advanced Logic Processor enables the designing of logic procedures (ALPs) that trigger based on any combination of events, including detection of alarms, changes to database fields, expiration of timers and ON/OFF indicators. Activation of the ALP can generate alarms, modify database fields, execute scripts or perform complex correlations.

POLICY MANAGER

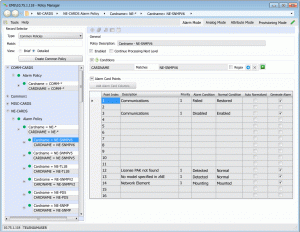
Policy-Manager

Policy Manager gives you extensive control over every alarm, event and analog handled by the Telenium system. Policies can be created to affect a myriad of characteristics including setting alarms to one of 99 different priorities, enforcing analog threshold limit checking and modifying alarm descriptions to improve readability.

ALARM INCIDENT MANAGER

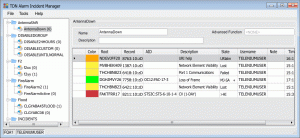
Alarm Incident Manager

Telenium allows associated alarms to be organized into incidents for better tracking and control of alarm events. Once created, these incidents are available in other applicable Telenium applications.

AREA OF RESPONSIBILITY (AOR)

Area of Responsibility

Telenium AORs allow correlation of alarms based on user-defined parameters such as geographic location, network element type, alarm severity, alarm impact, and many other combinations of criteria.